For Fixed Ops
Explaining Analytics and Reporting
Measuring and understanding your analytics can be a daunting task for any Fixed Ops Director. That’s why we’re covering our analytics platform here in easy-to-understand terms. These numbers are available to all of our customers to view anytime or can be automatically delivered directly into any inbox as frequently as requested.
If you’re not currently a customer—no worries! Understanding these basic analytics will help you begin to understand other solutions like Google Analytics.
It’s easy to get lost in all the data, which is why we’re going to quickly cover the most important numbers and what they mean in this article.
Unique Visitors and Conversions
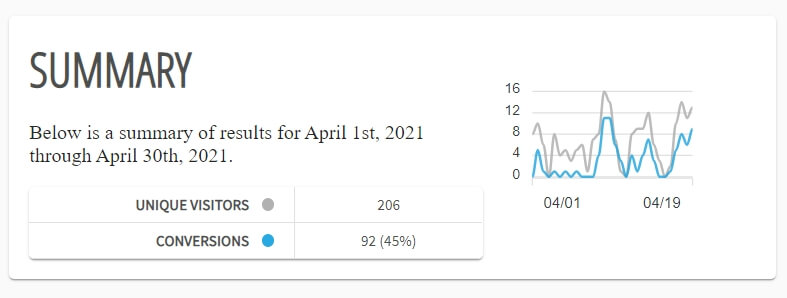
A unique visitor is someone who visits your website or landing page (once or multiple times) within a given time period. Of those, the number of visitors who filled out a form, sent themselves a text, email or other communication is counted as the number of conversions, or percentage of people who converted in that time period.
Conversion Details
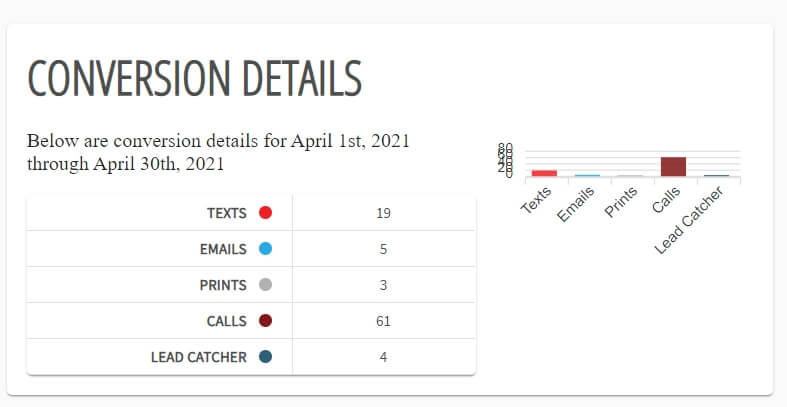
The conversion details show you a breakdown of how each conversion was made. This will give you an idea of how many visitors called, texted, printed, or filled out an online form and ultimately how they got marked as a conversion. Understanding how your visitors are converting will help you understand your demographics and your most popular conversion methods.
Page Details
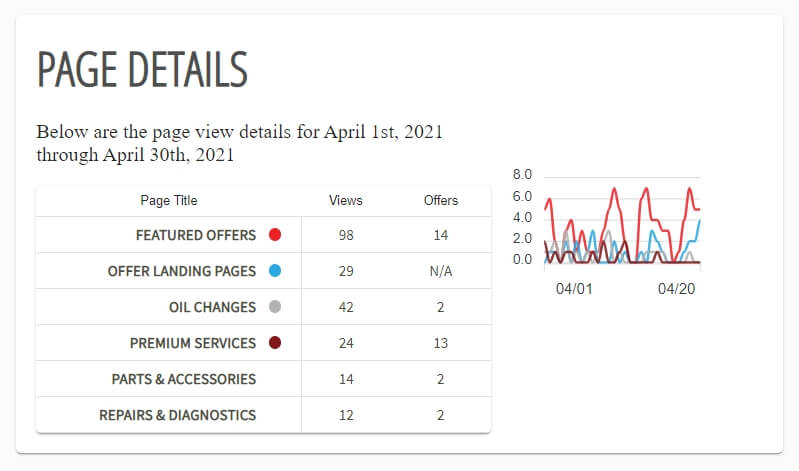
The page details will help you understand which landing pages are the most popular to your customers and how many views each of those pages have received. Are your premium services getting more views than your featured offers or vice versa? This information can tell you which service specials you should have listed on your landing pages first, above the fold (the visible area in which the site automatically loads for every visitor) so that you’re maximizing conversions.
Offer Interactions
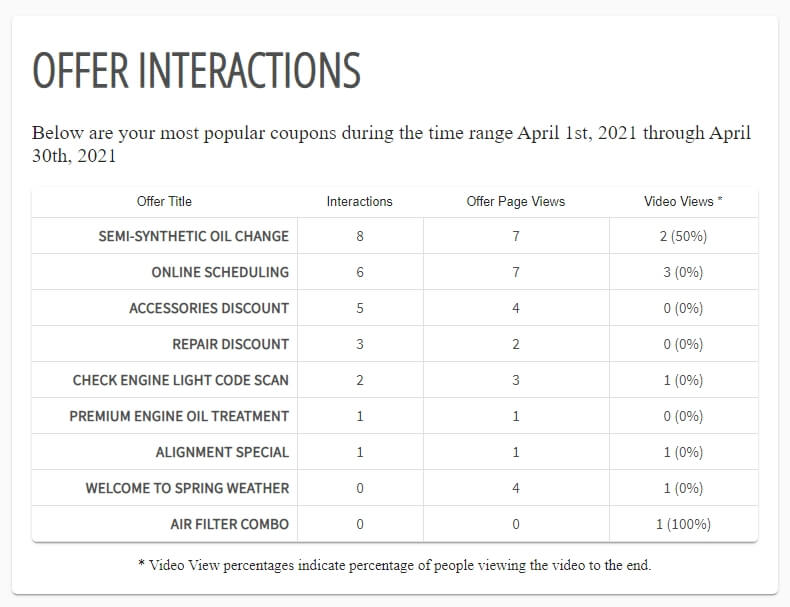
Your offer details will let you know which service specials are the most popular to your website visitors. You’ll be able to tell how many people have interacted with your specials (or converted), how many have simply viewed each special, and how many video views your specials are getting. This is good information to know when you want to double down on the specials that are getting more appointments and/or more upsells in your service center.
Date Ranges and Traffic Sources

The benefit of manipulating your date ranges is that you can compare your traffic and conversions month to month or in other time variables to help you understand which months are your most productive and which ones aren’t. You can also further narrow these data down by all traffic, or all organic traffic. This is especially helpful if you have paid traffic that you’d like to compare to the traffic that occurs organically.
Conclusion
We set up our reporting and analytics solution to be very simple and user friendly for the average visitor. Our goal is to help you better understand which pages and traffic provide you with the highest conversion rates and scheduled appointments. Of course, it’s always possible to dive deeper into these numbers and we are happy to give you a free demonstration of some of the advanced features of our analytics platform. However, for most users, these basic reports will provide you with the necessary information you need to see how our service marketing solutions provide an average of 20%+ conversion rates and an increase in service appointments.
REQUEST A 15 MINUTE ONLINE DEMO
Want more service marketing tips?
Contact us at marketing@www.fixedopsmarketing.com and we’ll help you with any questions that you may have with your service marketing needs and concerns.


