
Don’t Let the Numbers Fool You
Half truths – A look at perspective
It’s not uncommon to see reporting that aggregates data so that it implies all that data came from one source. It’s not only unlikely to see all traffic coming from one source, it’s highly unusual. Online traffic comes from a variety of sources, including organic, social media, internally, paid sources, etc.
If you’re not in marketing or digital marketing, etc., you’re probably not aware of how easily it is to manipulate the data—positively or negatively.
Let’s use Google Analytics as an example.
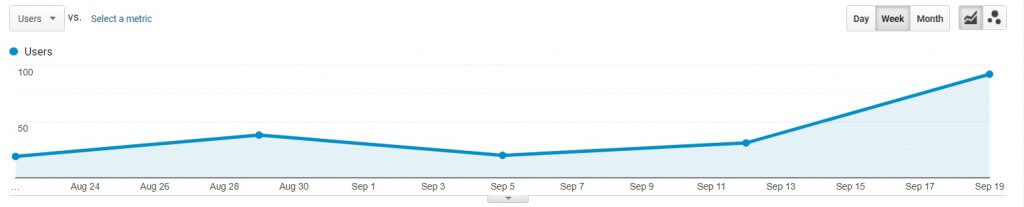
Let’s say the intention of this representation is to show an increase in users after September 11th.
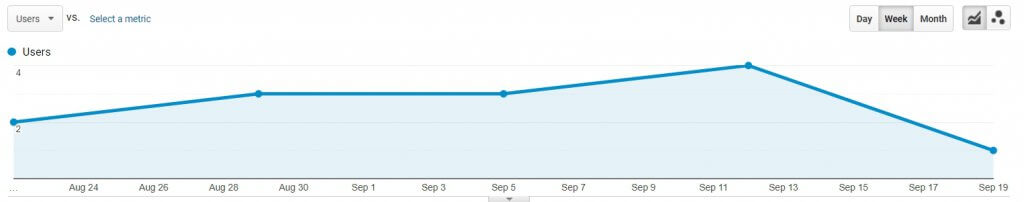
Yet, when looking at a filtered view of the same data, we see a decrease in users after September 11th.
The difference between these two representations is simply a filter. One representation is exhibiting all website data (a general increase after September 11th) and the other is showing a significant decrease based on partial data. You can’t tell that, however, by simply glancing at these two contradictory representations. Neither is unethical, yet depending on the intended perspective, one or the other could certainly be misleading.
It’s always good to ask yourself: What is the intent of the data? Occasionally, you should see lower numbers that are generally representative of the service sales cycles you’re already accustomed to, which helps you not only better understand where you need to grow, but also helps to show you that you’re reviewing transparent data.
In addition, if your data contains proper attribution to all sources and is transparent in representing the data generated by the originating provider, it’s much more likely that it’s trustworthy. As you review your reporting on a regular basis, you’ll become more accustomed to digesting the meaning, or perhaps lack thereof, in your reporting.
Your data shouldn’t tell a false story
Being presented with data that only tells the story of how great your service marketing is isn’t providing you with beneficial —or realistic—information. Your data must have context and guide you towards making evolving changes that will improve your service marketing.
Let’s look at an example.
This representation is the user data of a website broken down into a weekly view. It appears users have increased in the month of September, yes?

Now let’s look at representation #2. This representation appears to be telling you that users have decreased during the month of September.

The difference in these two representations is that one is presented in weeks, condensing the timespan, while the other months. In reality, the information on both graphs is the exact same, but when quickly scanned, one appears to tell a different story than the other.
The lesson here is to understand the context of your data. What does it mean? Is it a fair representation of reality?
You need to know what’s working, what’s not, where you need to improve, and what to remove. Low metrics on certain specials or videos isn’t necessarily negative, it’s more of a learning opportunity to ask yourself why. Perhaps that’s not a valuable service to promote in your market? On the contrary, high-performing pages and content need to be moved to higher priority points to be used as lead generators.
Increased page views is not always a positive metric
Increased page views is not always a positive metric. This is because a high page view metric often means that website visitors are bouncing around your website, unable to find what they are looking for, increasing your bounce rate (which is where visitors leave the website without converting).
The quicker a visitor finds the page they are looking for, the more likely they are to enter your service sales cycle. In most cases, if a visitor does not find what they are looking for on your website within 3 clicks, they’ll get frustrated and leave. Not only have you lost a potential customer, perhaps a recurring customer and a high-value one at that.
Be sure the data that you’re looking at is relevant data. When looking at general analytics—whether or not you’re sure if the data is clean —focus on the unique visitors, as well as conversions/new leads. Which brings us to the next point…
Where real value in service marketing comes from
The entire goal of your service marketing solution is to generate more leads or more lines per RO, or both, in order to ultimately generate more service revenue. Even if you’re not an expert in reading analytics, you already know your average monthly sales and revenue numbers. Quite simply, are they greater than they were before or not, and why?
This, no doubt, is an area where you are the expert!