Define Your Own Metrics for Success
+ Federal Reserve Case Study
Defining a Conversion
Do you define a conversion at a form entry, other online conversion point, or when a customer pays for service at the completion of an appointment? Perhaps you define a conversion as a lead that needs closing? Do you define a conversion or do you rely on a vendor to define a conversion for you? If someone enters your website, and in one way or another engages with the dealership, but never follows through with scheduling an appointment, or never arrives at an appointment, is that a conversion?
It gets fuzzy doesn’t it?
These sorts of metrics can be fuzzy, especially by Google Analytics’ definitions, where often there’s SO much data and it doesn’t always tell a truthful story (depending on who’s using the data and what kind of story that person is trying to tell).
Let’s be honest, sometimes it simply is not clear how customers find you. This fact doesn’t discount your service marketing efforts, but it certainly can discount reliance on data and analytics to tell you the full story. Service marketing significantly increases your online visibility, but marketing is not simply data and analytics. It’s about emotion. It’s about feeling. It’s about branding.
I’ll discuss this more, and I’ll show you an example of some serious fudging of the numbers to benefit the story, below.
Bounce Rates
Let’s look at one data point in analytics as an example of unclean data (discussed and defined below): bounce rates.
High bounce rates are bad right?! Not necessarily. Google defines bounce rates generally as poor if they’re high because that’s how Google has defined it. Google defines a “bounce: as someone who enters a single page and leaves. Therefore, if a visitor hits your service landing page and submits a form and leaves, that will add to your high bounce rate. Why? Because the visitor hit your website and left, as Google sees it.
Google doesn’t see a form entry as a successful conversion (unless you’ve gone through the cumbersome process of telling Google to include these form entries, chats, logins, etc. as “goals,” which 99.9% of you have not – I promise). If a customer enters your homepage and logins-in or registers, or chats and leaves, those all count toward your high bounce rates, according to Google’s algorithm. But you would likely consider that successful engagement to some degree.
Don’t get me wrong, bounce rates can be helpful. They can confirm an inoperable webpage, or other major problem occurring along your customer journey. But common sense can tell you that your 76% bounce rates are not due to lack of conversions if you have regular, healthy conversions, but perhaps more likely, a lack of defining factors.
It’s important to not rely only on these data points, as they all can tell a different story than you want to hear, depending on who’s telling you the story. Trust but verify – which I’ll discuss next.
We must stop looking at data as good or bad, but as a tool to help us answer questions about our online marketing.
Define Your Metrics for Success
Trust but verify. Look at your leads compared to your new customers or lines per RO. Ask your customers where they’ve come from if you don’t already know. Follow the “paper trail” provided by your service marketing solution (like FixedOPS Marketing).
You’re experienced in fixed operations. You already know where the vast majority of your customers come from. You can see if they’ve used a special or not. Analytics are simply a tool to help you answer questions like, “How is my service website performing?” and “Am I getting what I’m paying for?”
Analytics are great. But always remember, they are a tool. Much like money, you should treat analytics as a tool to reach a goal, not define a goal. Misuse is rampant. I’ve seen vendors take credit for all paid and organic traffic coming to a service website, both deliberately and inadvertently! I’ve seen vendors highlight those high bounce rates as failures. But are they always? What else could be happening? Is a web visitor who fills out an online form or “calls” a “failed” entry? Surely not!
Create a Definition that Works for You
Use your own knowledge and experience about your service center. You can tell if more customers are coming into your service center via your service website. You watch the numbers. You count the customers. You hear the feedback from your customers. You can make educated decisions about the effectiveness of one tool against another by what you see actually happen on the service floor.
Data is one tool that helps guide you and make decisions about your service marketing. And, you are the purveyor of your service department.
Use Clean Data
When you’re looking at the results of your service marketing solution, use clean data. Clean data, as I define it, is data that hasn’t gone through third-party software. When you look at the reports, you should clearly see the numbers that have come from forms, calls, texts, emails, prints, etc. (And, yes I count them all, as opposed to counting only some…?) These numbers are bare and can’t hide behind your paid ads or other marketing efforts.
What should be important to you, as a Manager in fixed operations, is how you define conversions, not how I do. If an unclosed lead is a conversion because you have the in-house support to close that lead, then make that your definition of a conversion, for example.
Chasing after numbers will only make you dizzy!
A Quick Case Study on Data Manipulation – The Federal Reserve
We don’t like to get political around here. And, regardless of what you think of the Federal Reserve, they are guilty of fudging the numbers in a big way – so big, it’s kind of funny. Let’s take a look.
The Federal Reserve has the power to control interest and monetary policy, which effectively, gives them the power to control your money. Therefore, it’s not always in their best interest to let you know what’s going on.
Earlier this year, Fed Chairman, Jerome Powell was accused of lying to the American people about the severity of inflation rates. It was argued that he misconstrued the data to make it seem like inflation was way lower than it actually was.
First, instead of using the CPI (Consumer Price Index) that averages out 8 different industries, including housing, apparel, transportation, education and communication, recreation, medical care, food/beverage, and other goods and services, which comprise of the majority of American’s expenses, the Fed used the PCE Index to measure price increases. The PCE Index (Personal Consumption Expenditure) looks at pricing on goods and services just like the CPI Index, but excludes food and energy, such as groceries and gas prices.
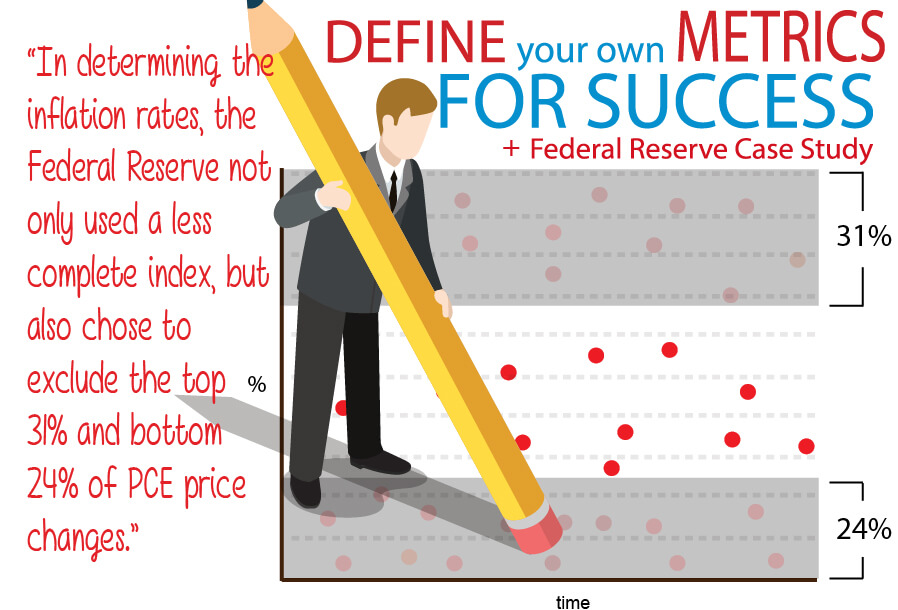
In determining the inflation rates, the Federal Reserve not only used a less complete index, but also chose to exclude the top 31% and bottom 24% of PCE price changes. So when coming up with its own inflation numbers, the Federal Reserve looked at a derivative of the PCE Index by removing the top inflation numbers and the bottom inflation numbers to make it look as though inflation wasn’t all that bad!
This is a wide-ranging example of how using less comprehensive data, and removing the most inconvenient features of that data can be used to construct the “story” being told. The story, in this case, is that “inflation isn’t so bad, so we can continue to print money and you should continue to spend it.”
Sure, if you want to pick and choose data points you can make the numbers look much more attractive to your “story.” By these data, we could say inflation prices haven’t risen hardly any. On the other hand, you’re the one filling your gas tank. You’re the one feeding your family. You are able to tell by your wallet whether or not these data seem factual to you without going through the effort of discovery here like I have!
The moral here is: Trust but verify!
Verify my data! The Wall Street Journal article that covers this fiduciary disagreement can be found here.
To learn more about how data can be manipulated, check out this blog: Don’t let the numbers fool you.

Analytics and FixedOPS Marketing
We know a lot about analytics here at FixedOPS Marketing. We provide our own clean data, automatically, as often as wanted, directly to our customers’ inboxes. Schedule a demo to learn more!
If you have questions about your data or would simply like to know more about service marketing in general, email us!